OriginPro 8.6 SR2

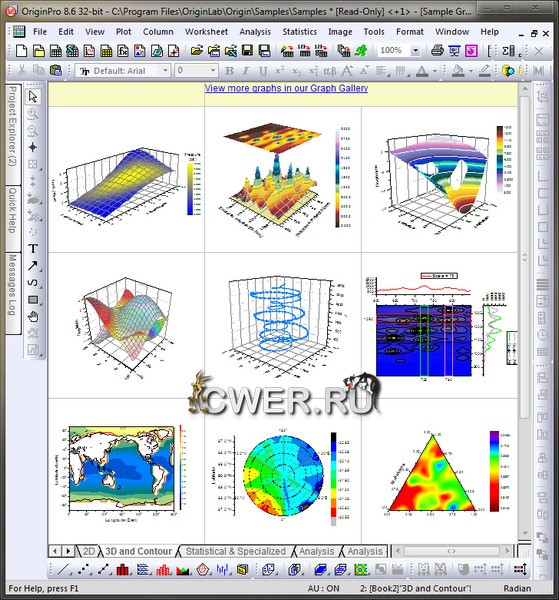
OriginPro - мощный и полнофункциональный научный пакет для анализа данных. OriginPro представляет собой универсальное средство обработки математических и статистических функций, построения графиков этих функций, а также инструмент разработки узкоспециализированных математических программ и средств визуализации графических данных. Microlab Origin может составлять конкуренцию таким известным программным пакетам, как MathCAD и Mathematica. Считается стандартом де-факто во многих научных лабораториях. Интеграция с системами сбора данных таких как LabView, DasyLab, LabWindows. Совместимость с MathLab, MathCad. Кто занимается анализом тот знает что это за пакет. Для остальных это полная замена Excel, по функциональности и удобству.

Peak Fitting
The Peak Analyzer tool in OriginPro provides the additional capability of finding and fitting multiple peaks in your spectra. Baseline anchor points can be customized and fit with a suitable fitting function, and the baseline fitting can be included as part of the final peak fitting process. A detailed Fit Control dialog is provided to control all aspects of peak fitting including mixed peak functions, peak centers and widths, sharing parameters, and imposing bounds and linear constraints on parameters. Graphical as well as tabular results are generated as part of the final fit report.
Surface Fitting
OriginPro can fit a 3D surface to XYZ data points. The surface and data points can be displayed together, including droplines from the points to the surface.
Statistics
OriginPro expands on the statistical analysis capabilities of Origin by providing additional tools for Descriptive Statistics, Discrete Frequency Counting, Normality Tests, Correlation Analysis, One-way and Two-way Repeated Measures ANOVA, Principal Component Analysis, Hierarchical Cluster and Discriminant Analysis, many Nonparametric Tests such as Friedman ANOVA and Two-Sample Kolmogorov-Smirnov Test and Mann-Whitney Test, Survival Analysis tools including Weibull Fit and Cox Proportional Hazard Model, ROC Curves, and Power and Sample Size Tests.
Signal Processing
Advanced signal processing features in OriginPro include Short-Time FFT (STFT), Hilbert Transform, Coherence, 2D FFT and 2D FFT-based Filtering, 2D Correlation, and Wavelet analysis.
Image Handling
OriginPro offers more ways to handle your image data, including alpha blending, pixel logic, morphological filtering, and interpolated background subtraction.

ОС: Windows XP/Vista/Win7 x86
64-Bit Support
- Origin 8.6 is available in both native 64-bit and 32-bit versions. The 64-bit application provides:
- Improved memory management
- Improved handling of large datasets
- Memory capacity limited only by installed hardware (32-bit application limited to 2 GB)*
*Individual worksheet columns and matrices are limited to 90 million elements each.
Zoom and Scroll inside Graph Layer
Use the mouse and scroll wheel, or use the keyboard, to zoom and scroll inside a graph layer, in either X or Y direction. Quickly identify data sub range of interest and then use tools such as gadgets to analyze your selection.
Auto-hide Capability for Dockable Windows
Set dockable windows such as Project Explorer, Quick Help, and the new Messages Log, to auto hide mode. This frees up space in the Origin interface, and you can easily access these auto-hidden windows when needed. Some windows such as Messages Log will pop up even in auto hide mode, to display important messages.
New Gadgets
Based on multiple requests from our users, we have added three new gadgets in this version:
- Vertical Cursor
Read X and Y coordinates of multiple data plots inside a layer or even across multiple stacked layers. Output the coordinate values to a worksheet, or tag your data with a line and label at desired X values. - Quick Sigmoidal Fit
Perform a quick sigmoidal fit to data within a region of interest. Select from multiple built-in fitting functions or use your own fitting function. Display asymptote lines and optionally fix parameters to desired values. - Intersect
Calculate the intersection points of multiple curves within a graph layer. Tag the intersection points and send the coordinate values to a worksheet.
Spider/Radar Chart
This new plot type is ideal for displaying and comparing multivariate data. A custom dialog is provided for control of axes, including the ability to set each axis to a different scale.
With a few datasets, Origin’s color transparency feature can be used to overlay datasets for comparison. With many datasets, it is easy to set up the plot properties and then separate out the datasets to multiple layers to compare them side by side.
Parametric Function Plots
Create 2D function plots using parametric equations. Save your favorite equations as themes for repeat use. Modify the plot parameters in Plot Details dialog at any time, and copy paste the settings from one plot to another.
Statistics: Multivariate Analysis (Pro Only)
- Four commonly used multivariate analysis tools are new available in Origin 8.6:
- Principal Component Analysis
- K-Means Cluster
- Hierarchical Cluster
- Discriminant Analysis
Nonlinear Fitting with Integral
The Fitting Function Builder has been updated to support creation of user-defined fitting functions that included an integral.
Worksheet Navigation Dialog
This new dialog allows you to view and manage multiple sheets in a workbook or a matrix window. Sort the list of sheets by name, size, and other meta data properties. Change the order of sheets, or select multiple sheets to duplicate or move to a new book.
Import Menu Customization
Origin imports many widely-used third party data formats using custom dialogs acccessible from the File: Import menu. This new version provides a dialog to customize the sub menu to add/remove file types.
Скачать программу OriginPro 8.6 SR2 (406,97 МБ):

